
John D. Aber—
Where are the biggest unknowns, the biggest mysteries in our understanding of weather and climate? They are not where you might think.
Scientists make monumental efforts each day to update the detailed weather predictions we receive as those little icons and temperature predictions on our phones and tablets. The science behind those icons is very well-known and the fact that the accuracy of predictions fades after about a week is due more to incomplete measurements of the atmosphere than to an incomplete understanding of the science.
The momentum we have created in the long-term climate system through the increase in greenhouse gases is also clear, as is the role of ice caps and oceans in delaying the impact of those gasses. Oceans have so far absorbed about 40 percent of the carbon dioxide we have emitted, and perhaps 90 percent of the excess heat generated through the greenhouse effect, creating inertia in the climate system that has delayed what would have been a much more rapid increase in global temperatures.
That inertia translates into irresistible momentum going forward, making our challenging climate future relatively easy to predict. The biggest uncertainty in our climate future is not the science, but what we choose to do about greenhouse gases.
The mysteries lie between the daily purview of weather prediction and the decades to centuries timeframe of climate projections—in a temporal space dominated by climate oscillations.
What are climate oscillations?
They are cyclical changes in the state of oceans and atmospheres at key locations within the global climate system that affect local to regional weather. This year’s weather (and maybe next) can vary widely depending on what these oscillations are up to, and their dynamics can seriously deflect, for a year or two, long-term trends in climate.
You are familiar with some of the better known oscillations through their dramatic names and equally dramatic impact on weather extremes.
Perhaps the most familiar is the El Niño/La Niña (or ENSO) oscillation, a roughly 5-7 year (but highly variable) cycle of change in sea surface temperatures in the equatorial Pacific. The warm phase of this cycle has, in the past, altered the path of the jet stream over North American and brought increased rainfall to the California coast.
Our first mystery is this: we cannot predict accurately either the timing or the intensity of El Niño events more than a couple of months in advance.
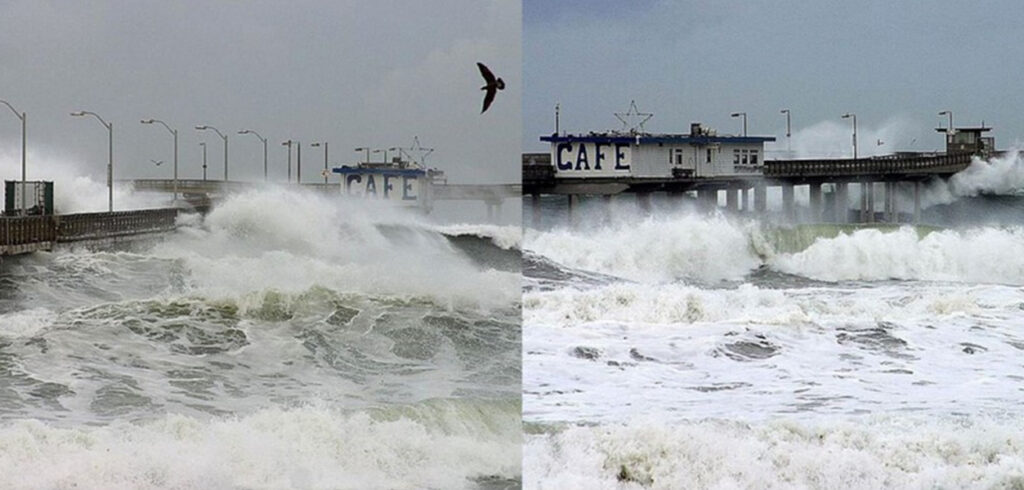
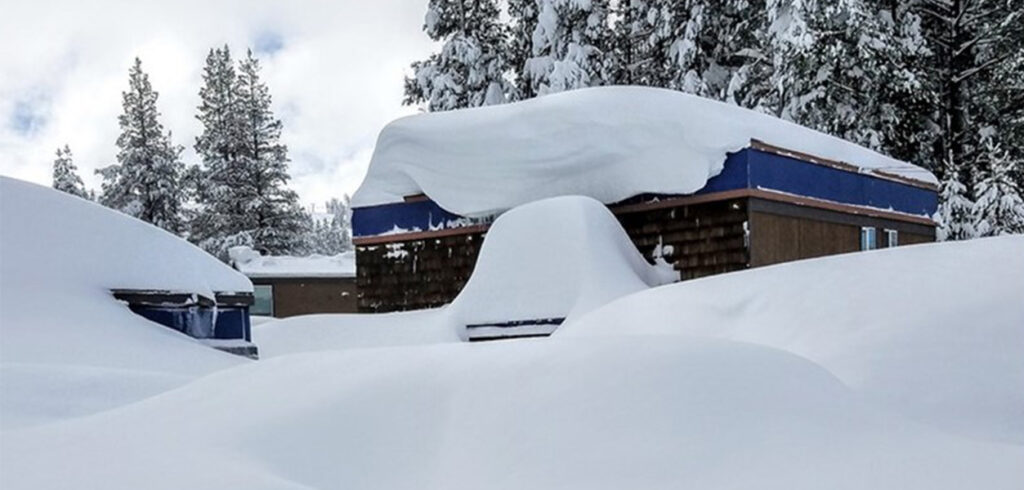
A second mystery is revealed by last winter’s extreme rainfall and snowfall along the west coast that happened during a La Niña event (colder than normal ocean temperatures) when past experience would predict a drier than normal winter in California. We can describe what happened last winter to drive that record-breaking weather, but no one predicted it, because a different oscillation played a dominant role.
The Madden-Julian Oscillation (we don’t have an official “nickname” for this one yet, but I think MoJO might catch on), drove wave after wave of tropical moisture from the Indian Ocean across the Pacific to be delivered in a series of atmospheric rivers to the California coast. So an unusual interaction between two oscillations spelled either relief (from drought) or disaster (by floods), depending on your point of view, for California.
Unusual is a term often applied to the impacts of oscillations. They seem unusual for the very reason that we don’t know how to predict them!
Another now-famous driver of extreme winter weather is the polar vortex. The actual vortex is the generally tight cycling of the polar jet stream that contains frigid arctic air over the north pole. The vortex makes news when a rush of warmer air into the upper atmosphere over the pole weakens the vortex, allowing super-cold arctic air to escape to northern parts of North America, Europe, and Asia. When these tongues of frigid air fall onto populated regions, the polar vortex becomes big news.
Only the better news stories will note that it is a breakdown of the vortex that allows the cold air to escape, and that it is a warmer upper atmosphere over the pole that opens the gates. Cold air outbreaks in a warmer world. The strength of the vortex itself is not an oscillation, but a product of the Arctic Oscillation that captures changes in air pressure over the north pole.
These three named and known oscillations are just the tip of the iceberg. Wikipedia lists 15 that basically cover or affect every major part of the ocean-atmosphere system. Descriptions, and even the names, vary across sources, suggesting that this is not settled science and we have much to learn.
In practical terms, we cannot yet predict whether next winter in California will be a classic El Niño event with elevated rainfall (as sea surface temperatures in the central Pacific are rising), or dominated by MoJO or another oscillation. The same can be said for all the major oscillations.
So this is an area ripe for meteorological research, but there is a problem here.
The accuracy of weather models fades too quickly to be of any use in predicting oscillations or next year’s weather. On the other hand, the momentum we know is occurring in the long-term climate system—how average temperature, sea level rise and ice melt will proceed—does not tell us much about next year’s weather, either.
The seasonal to multi-year time frame belongs to the oscillations. At this point, increased understanding of the dynamics of oscillations seems to rely more on traditional meteorological methods, of finding patterns that can be explained by known physical relationships, than on precise first-principles modeling.
The danger here is that the dynamic, interactive state of all these oscillations, and their impact on seasonal to annual weather extremes, might distract us from the very certain long-term trends.
Here is an analogy that might help capture the dynamic nature of oscillations and their interactions. Schools and other organizations often used team-building games to enhance a sense of community and shared purpose. The parachute game is one example. Maybe you have watched this or played it, but if you haven’t, there are lots of good videos on the web. A large circle of light parachute material is placed on the ground and the players are evenly spaced around the perimeter. Each person grabs the parachute at their location and then lifts and lowers their little corner of the fabric either at will or under direction. The result is an ever-changing pattern of hills and valleys that form in part by your wave crashing into waves generated by other players. Great fun.
Let’s say that the average distance between the parachute and the ground represents global average temperature, and the holders are the oscillations. Given all those constantly changing hills and valleys, how can you tell if the average distance between the ground and the fabric (global temperature) is changing? A scientist might ask: How can you distinguish the signal (change in average height) from the noise (the fluctuations).
If, on the other hand, all the players are on a slowly rising platform, the increasing distance to the ground will eventually become clear. In terms of climate change, we are riding that rising platform.
As we continue to learn more about oscillations and hopefully learn to predict how they will change and how they interact, it is important to understand that those annual variations and extreme weather events and seasons, which grab all the news headlines, are just small deviations along the path we are clearly traveling into a warmer future with rising seas and a more energetic atmosphere.
John D. Aber is university professor emeritus of environmental sciences at the University of New Hampshire, where he also served as vice president for research and as provost. He lives in Durham, NH.
 Deobandism, Islam and the Religious Narratives of the Taliban